Zeitgeist - News Highlights
America’s Housing Mismatch
Since the start of the 21st century, it has become increasingly common for Americans to live alone. As of 2020, single-person households represented 27% of the population, up from 7% in 1940. From 2010-2020, 44% of U.S. household growth was contributed by sole-person households. This trend’s most notable housing consequence is the increasing mismatch between the existing housing stock – lots of single-family homes built for families – and more Americans living alone and needing less space.
To make matters worse, Gen Z – Americans born between 1997-2012 – represents more than 20% of U.S. renters and is forecasted to be the largest renter cohort by 2030. Since Gen Z renters are younger and, like Millennials, often delay marriage, many are choosing to live alone, further exacerbating the housing mismatch.
In response to this trend, developers are gravitating toward smaller housing options including one-bedroom apartments, studios and micro-units. Also, state governments – most recently California, Maine and Oregon – are amending their single-family zoning mandates to address the gap between single-family homes and high-rise apartments. Supporters of these new zoning laws cite affordability, racial equity and climate change (more density means less reliance on cars) as positive outcomes.
Existing homeowners generally oppose these laws as they fear traffic, parking issues and a degradation of their neighborhoods’ character. Many of these laws are facing opposition from constituents. One, California’s controversial SB-10 – which allows local governments to zone up to ten homes per single-family parcel in transit areas –has yet to be adopted by any cities in the State.
Today, nearly two-thirds of American households are just one or two people. As our nation battles a widely publicized housing affordability crisis, it’s also fighting a much-less-discussed housing mismatch crisis.
From Blue to Red
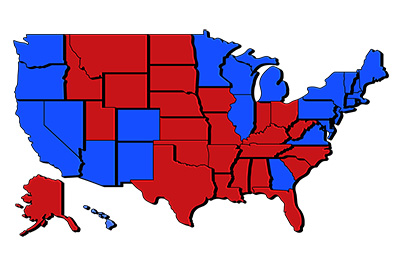 The U.S. Census Bureau’s recently released 2022 migration data shows a trend of accelerated migration from blue states to red states. California lost the most residents from outmigration (-343,000), followed by New York (-300,000) and Illinois (-142,000). Meanwhile, the three states with the most in-bound migration include Florida (+319,000), Texas (+231,000) and North Carolina (+100,000). For the first time since 1957, Florida had the fastest growing population of any state with an annual population increase of 1.9%.
To quantify the fiscal impact for states, the IRS publishes data on the movement of taxpayers by level of adjusted gross income (AGI) across state-lines each year. In 2021, the average AGI of individuals who moved to Florida was about $150,000, more than double the level of those leaving. The taxpayers leaving Illinois and New York typically made $30,000-$40,000 more than those arriving. Nearly a quarter of the individuals leaving Illinois made $200,000 or more.
The influx of high-income earners increased Florida’s AGI in 2021 by $39.2 billion – up from $23.7 billion in 2020 – with approximately $9.8 billion coming from those arriving from New York (which lost $24.5 billion AGI in 2021). Texas was another big winner with an additional $10.9 billion in AGI with more than half of the gain coming from those arriving from California. California’s total AGI loss in 2021 was -$29.1 billion, more than triple 2019’s figure. With higher income earners leaving blue states and lower income earners arriving, these migration patterns will have a meaningful impact on state budgets for years to come.
Share this Article
